What does the balance Sheet tell us? It is a business scorecard, like the income statement. While the income statement tells us how successful our business operations have been over some interval of time, the balance sheet is a snapshot about how financially strong the organization is at a point in time.
Several indicators of financial strength are apparent from the balance sheet.
- Size of the business. How big is the business. Has it grown since the same time last year? Has is shrunk? Size is measured by the monetary value of assets. How much stuff does the business have? What are total assets? What were they a year ago.? This is not the only measure of financial strength.
- How much liquidity do we have? Liquidity is the extent to which we have some assets that can be quickly used to pay bills if we have to. How liquid we are is determined by whether our assets are cash, or can be quickly converted to cash if we needed to. Obviously, in the above example, we have liquid assets in the form of cash and savings accounts. The other assets could (eventually) be converted to cash, but it would take time. Only a small fraction of ou assets are liquid. Has our assets been changing to be more or less liquid over the past year?
- How much debt do we have? Has our debt grown over the last year? Obviously a business is stronger if, other things the same, it has less debt. But debt is a very important way of acquiring assets in a business—for the same reason it is important in our personal life—sometimes businesses cannot acquire assets any other way than by borrowing. Obviously borrowing is a risky way to acquire assets because you have to not only generate enough income in the future to pay back the loans, but you also have to earn enough income in the future to pay even more back than you borrowed (interest costs).
- Has equity of the business grown?.The equity, or net worth, is the amount of the business that the business actually owns (after we pay off our debts). Is it growing? Is it shrinking. When firms make profit from operations, or get philanthropy, these are direct infusions into equity.For profit companies can also raise equity by selling stock, essentially giving partial ownership to investors. To maintain their ability to raise equity capital, such firms try very hard (sometimes too hard) to keep their stock process high and rising, More later.
The balance sheet is a scorecard for a business that shows various indicators of financial strength. If you were thinking of acquiring a business, or selecting one to be a supplier to your business, or thinking of attaching your career to a firm—you might want to look at how strong the business is by examining the balance sheet.
Unlike the Income Statement, the Balance sheet does not show how profitable the business has been during some window of time. Rather, the Balance Sheet shows how string the business is financially at a particular point in time. So, the balance sheet always has a date showing when the assessment of financial strength was constructed.
What the balance sheet does is conceptually quite simple. It lists the assets of the business on that date, and the debts of the business on that date, and the gap between them, which is called equity. You could imagine doing a personal Balance Sheet for your household: what assets do you have? List the assets—they are anything of value you have — a car, a bunch of furniture, maybe a home, jewelry, golf clubs, a kayak — basically anything of value. Next to the items, list the money you paid for the asset when you bought it. This list of assets and what you paid for them is the left side of a Balance Sheet—- and it is exactly the same for a business.
Checking account balance 1500 Auto loan balance 12,000
Saving account balance 500 Student loan principle 13,000
Ford escort 15,500 Credit Card Balance Due 3,500
Furniture (various) 7,500 Total Debt (Liabilities) 28,500
Canoe 300
Watch 200
Clothes 3,500 Total Equity 500
Total Assets 29,000 Total Equity + Liabilities 29,000
Then list your debts (what you owe other people on the date of the balance Sheet. Listed above on the right side of the balance Sheet. Total Liabilities represents the claim of people you owe money to to “claim” ownership of that amount of your assets. Some debts may be set up at mortgage arrangements, where the lender would claim one of your assets which was offered as collateral for your loan (your home mortgage, or car loan) so if you don’t pay the debt, they get the asset. Other loans do not have collateral—like credit card debt.
Your Equity needs to be calculated. It is simply Total Assets – Total Liabilities = Equity. This is the amount of the assets that the business (or the person) actually owns. Sometimes Equity is called by different names: Net Worth, or Fund Balance. But, the formula is always the same. Take the value of all the assets, subtract the debts owed, and what’s left is Equity. If you were doing this in the case of the household, think about it this way. If you had a huge garage sale to dispose of everything of value you had (eg your assets) and were able to see all of them for exactly what you paid foreach of them, and then used the money to pay off all the debts—then what is left would be your equity. Note above, I computed our equity as 500. So, the sum of Equity and Liabilities add up to Total Assets. This is what is meant by the term “balance Sheet”—- both sides balance. Said another way, all the assets of the firm (total assets) have to be owned by someone— either they are owned by creditors of the business (the folks the business borrowed money from, or owned by the business itself as Equity. So, in the above example, the size of the business is given by the amount of total assets it has (29,000), these assets have been able to be acquired (or financed) by considerable debt (28,500) leaving the equity or the owners value to be only 500.
Some assets depreciate in value as you own them. The “long term’ assets are listed on the balance sheet at their “net” value, rather than what you paid for them. Take your car, for example. Say you bought is 3 years ago for 20,000. Its value will fall as time passes. To measure what the asset is worth today, we must ask what is the useful life of this asset? And given this, we can compute what the asset is worth 3 years later. Say, for example, we expect the car to last 10 years and be worth 5000 at that time. So, over the 10 years we would ‘use up’ 15,000 or about 1500 a year for 10 years. So, if we have prepared this balance sheet 3 years after purchasing the car, we have used up 4500 of depreciation. So, the value we would put on our balance sheet for the car would be 15,500 (or 20,000 – 4500 ). We would list the asset on the balance sheet as:
Ford Escort (net) 15,500
Why do health care organizations use so much debt? Health care organizations customarily use a lot of debt to finance the acquisition of assets. Typical hospitals have between 30-50% of their assets financed by debt (this is called the debt ratio = debt/assets.
Sometimes the option of saving up ( by earning profits and retaining them) in order to buy things of value is simply not quick enough in hospitals and other businesses. This dilemma is identical to that of families trying to buy a home in a good neighborhood with good schools. Saving up will delay the process too long, and the benefit of having the asset will disappear if we wait to long to acquire it. So, all of us including businesses who face this problem solve it by taking on debt. Debt allows us to have our asset now, and pay for it later. This is especially true in the fast-changing technology environment of hospitals, where waiting till we can write a check for the new outpatient surgery center may hurt us immeasurably.
There are several reasons why hospitals often (but certainly not always) carry such a high debt load, relative to other businesses.
- The cost of debt is lower for non profits. Non profit organizations are able to borrow money for lower interest costs than for profit organizations. This is because the when they pay interest to investors (who lend them money) those investors can often deduct the interest payments they receive from the income before calculating the taxes they owe, That means that when an investor is considering options for lending money to firm X a for profit in order to get a return or interest payment of 8% —– and loaning instead to the non for profit health care organization—– she knows that taxes will need to be paid on the 8&, but not on the interest income from the not for profit. So, as a consequence, interest on non for profit debt do not need to be as high to keep get the investors money. The interest paid by non for profits may be only 4-5%. This “break” on interest rates paid by non profits is partly responsible for their higher propensity to borrow than comparable for profit firms.
- Health care organizations often need to make big and otherwise unaffordable investments to keep themselves competitive. This is due to the rapid pace of technology changes in the industry, and the urgent need to make big facility and diagnostic technology investments. When they need to set up an MRI facility, they need it. When they need to make large expansions of outpatient surgery capabilities to take advantage of arthroscopy and laser methods—they need to do it quickly. They often just don’t have time to “save” profits to buy what they need.
- Outlooks for returns on investment are often “favorable” in health care. The demographic boom, the bottomless trough of Medicare payment, the prospect of continued explosion of health spending—puts the health care organization in a positive frame of mind about being able to repay debt (they begin to be hopeless optimists like Don Trump)
Health care organizations usually borrow money in the form of “bonds”, which are essentially a non collateral form of IOU. Look at your balance sheets from your organizations and see if it says Long term Debt in the form of bonds? The interest rates paid on bond borrowing are driven by the “bond rating” which is an assessment by a one or the other of several wall street firms (Moodys, others) which is an assessment of the firms ability to repay the debt. These firms earn money for the data collection they do to make the ratings for 1000’s of organizations (not just health care, but most corporate businesses too, who also use bonds to borrow money).They get paid for their work by clients in the investment businesses including banks and mutual funds, who pay the rating companies for their ‘ratings”.
These firms do a very very knowledgeable assessment of the situation of the organization, and how they are doing vis a vis competitors, what their strategy is, how well it is working, what the threats are to doing less well in the future. They summarize their assessment of the financial capacity of the borrowing organization in the form of a bond rating (A++,A+, A, B++,B+,B etc.). The higher the rating , the lower the interest rate. The bond ratings are crucial things that health care organizations pay attention too. The ratings change, and these changes are really really important to the organization.
Bond ratings relate to risk of repayment. Lenders (and investors of all types) are very interested in the level of risk when they make investments. Risk is related to the variability in earnings of the business. All businesses a subject to variability in earnings (profit) and these swings in earnings expose the firm to their ability to deliver the return investors are expecting on their investments.
More on Risk and Debt
Generally we think of the firm as needing two kinds of investors: investors that loan them money (debt), and investors that provide money in exchange for shares of ownership (equity). Both types of investors expect a return commensurate (or higher) with the risk they are exposed to. For equity investors their return is contingent on expected future profits; some of which may be paid to owners in the form of dividends, and some may be “earned” in the form of stock price appreciation (so that when they want to sell the stock, it will have a higher market price).
Investors who lend money get a return in the form a fixed interest payment for the use of their money. This rate is specified in the loan or bond, and does not vary with profitability of the firm. Risk for debt investors is related to the swings in profit that may jeopardize the ability of the firm to pay the required interest payments, or jeopardize the repayment of the principal of the load. Risk for equity investors is the swings in profit that may affect the ability of the firm to pay dividends (or the size of dividend payments), and the profit swings will almost certainly affect the market value of the stock (as profits go up and down the attractiveness of the stock by other investors changes).
From the viewpoint of the firm, there are two types of “risk” for a business.
- business risk — the swings in profitability facing investors stemming from market influences; competitor actions, new products, changes in consumer tastes, business cycles in the economy, price changes for resources, etc.
- financial risk — the swings in profitability stemming from debt.
The most direct way of visualizing the influence of debt on risk is depicted in the illustration in the table. We compare the firm in a situation of no debt on the balance sheet ( no leverage) with the same firm with debt (leverage). These are shown as columns below. The rows show what happens in a good year and a not so good year. We calculate the return to equity (ROE) in each of the four scenarios. In a good year the firm earns as profit of 5. The upper panel of the chart shows this situation. The firm has assets of 100. In the no leverage situation these 100 in assets had to be financed by equity. This makes the return on equity in a good year 5%. When half the assets are financed by debt, then the owner’s equity needs to be only 50. This makes the ROE equal to 10% (5/50 = 10%)
| No leverage | Leveraged
situation |
|
| good year | Profit= 5 | Profit = 5 |
| Owner Invested | 100 | 50 |
| ROE= 5 % | ROE=10% | |
| bad Year | Profit= -1 | Profit= -1 |
| Owner Investment= | 100 | 50 |
| ROE= -1% | ROE= -2% |
In the lower panel of the chart we show a bad year, where profit is only -1. For the non leveraged situation the ROE is -1% (-1/100). In the leveraged situation the ROE in the bad year is -2% (-1/50). Thus the good year has a higher ROE when debt exists, and a lower ROE when debt exists. Higher highs, and lower lows. More debt increases the amplitude of the variations in ROE. More debt increase the risk of the business. This is shown in the chart below.
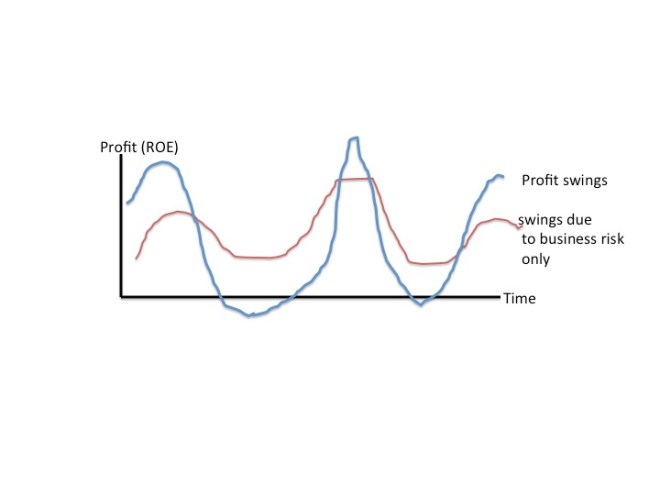
Financial risk stems from debt, which increases the amplitude of return to equity swings (eg risk) for the business. But, financial risk does not stop the use of debt, particularly in hospitals and other non profit organizations. There are a number of reasons why debt remains an important source of financing.
- The interest rate paid by non profits is lower than the rates paid by for profit borrowers. This stems from the tax write off of interest earnings available for lenders to non profit organizations (municipal bonds).
- Cost of debt is independent of business earnings (owners don’t have to share success)
- Owners don’t have to share control with debt financing; equity means part ownership
- Firms can offer more services (and be bigger) than if they were financing with equity alone
- Debt service is a fixed charge— and declines in earnings create liquidity risks (financial risk)
And, there are disadvantages to using debt:
- Firms with Debt (leverage) are riskier to ALL investors, and will need to pay more to raise capital in all forms
- Debt contracts have to be repaid on a schedule, and this may not be convenient
- Debt contracts may contain restrictive managerial covenants
- Only a limited amount of debt capital can be raised at “reasonable” interest rates. As the amount of debt increases, lenders will lend more only at higher interest rates.
