Health Spending and Health System Productivity
Health spending has been increasing fast in America for a long time, now about 18% of GDP. We spend over 40% more than any other health system, though it isnt at all clear if we are getting our money’s worth. We constantly debate the issues of why this is happening, whether its been worth it. The question of being “worth it” or not rests, in the end, on what we’ve been getting for the additional spending: eg the trend in productivity (output per unit input).
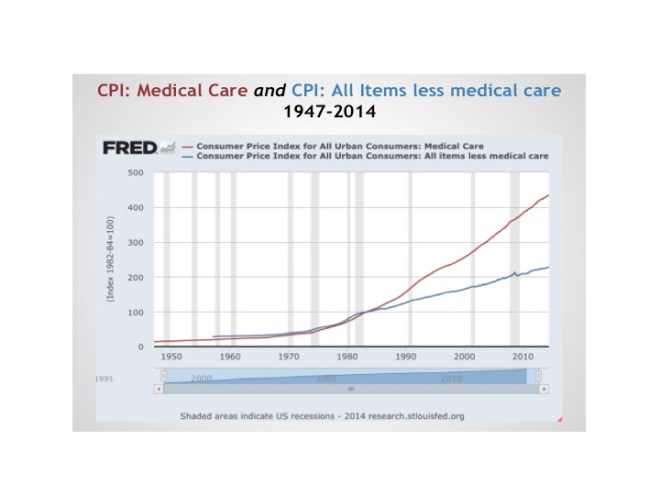
The following chart tells us about the trends in the American health system and its spending trends vis longevity. It implies we don’t get much “Bang for the Buck” (outputs per input) out of the American Health system. This relationship also suggests the ever flattening shape of the U.S. “production function” for Health — something often characterized as “flat of the curve” health care in America. Take a look at this chart.
This chart begs the important question—- for all of our additional spending, are we getting our monies worth of output—- health, or service quality or something of value? This problem is two fold: (1) we don’t have a good measure of “output” or “what we’re getting” in healthcare to measure productivity with. We have imperfect measures like longevity, or infant mortality, and (2) we have several good reasons to believe that we are pushing technology forward too fast, with strong incentives to adopt innovations that don’t add as much to productivity (whatever it is) as they add to costs. And, we are spending more and more on fewer and fewer people (more concentration see chart)
And we can be pretty sure that we are not purchasing a lot of new additional access to care. So what are we getting?
This kind of puzzle seem tailor made for something like cost effectiveness analysis (CEA) —- which is a perfect tool more taking individual technologies and deciding whether they add more to health (measured in the form of impact on DALYs, QALYs or YLS) as they add to costs. But, while such methods can be used for individual interventions, at the level of the entire health system, the CEA method is hard to apply, since the impact on health of the flows of hundreds of technologies is impossible to gauge. This productivity question is a very hard problem in health care, and has occupied the best minds in the field for many years.
Spending and Inflation
Many factors contribute to the health spending growth. The main reasons appear to be:
- rising incomes in the U.S. As people are economically successful, their incomes rise and they want to spend some of that additional income on better health for themselves and their family. Since the U.S. has among the highest incomes in the world, the people simply want to demand more health care.
- Our prices are higher here for health services and products. Mainly this arises because our content (intensity) of services is higher. We deliver more content in a hospital day, for example, than a day would consist of in other countries.
- aging of the population, yes, longevity is a product of our health system’s success—we live longer—and old people have a number of chronic health problems, often very expensive ones—-that need fixing. Daily regimens of expensive drugs, more visits, and more prolonged periods of poor health at the end of life all contribute to the fact that spending is so high when we compare it to less successful systems (in very poor countries) —- where people die of acute disease at younger ages— and average life expectancy at birth is only 45 or 50.
- more/better insurance. Insurance of all kinds lowers the price of care at the point of service, where we may pay only a fraction of the full price for service —and this low price encourages us to want to buy more than we otherwise would buy.
- provider payment incentive –-they are paid in various ways for their services–but mostly these payment policies share an expensive feature: we pay more to those providers who do more. This feature of the way we pay encourages providers to do more, and they do.
- Administrative waste, fraud, and medical error. Possibly a third of our spending is avoidable for these reasons.
- poor allocation of our health spending. We spend virtually all of our money detecting and trying to cure disease. We adopt every new procedures, every new drug, every new subspecialty, and excel at spending billions to try to promote dubious but heroic attempts to extend the life of frail elderly and other dying persons. On the other hand we spend very very little on primary or secondary prevention—and spend virtually nothing trying to change lifestyle choices (which is the main driver of health). If we reallocated our spending, we would have longer, healthier lives in America.
- Aggressive adoption of innovation & technology–But, those who have studied these spending trends generally point to the importance of technology adoption as the most important spending driver in health care. While the methods of assessing impact are indirect, they suggest that infusion of new technologies into health care in the last 75 years has been responsible for 33–60% percent of the spending growth. While the treatments and preventative success of research and development work (R&D) have been impressive, research doesn’t tell us anything about whether the higher spending has been “worth it” in terms of outcomes. We come back to that below.
Technology
The dominant reason why experts believe that spending is rising so fast is the infusion of technology (drugs, equipment, and general knowledge about disease and prevention and treatment). For example:
- Huge changes in way medicine works–In 15 years, studies report only ¼ of the top selling drugs remained being used
- 10% of the top 200 drugs are new each year
- In the late 1960s, cataracts Px required 3 day stay—now it may be several hour stay in day surgery
- Low birthweight infants —artificial lung devices—decreased mortality to 1.3 the 1950s level+ huge QOL effects too
- Pretty much everything we know about and utilize to diagnose and treat was unknown 40 years ago
David Cutler has done several studies of technology adoption in health care and identifies some of the steps in improving the care (and the results) in the area of cardiovascular health. It offers a good example example of how new technology has changed the treatment and prevention of a disease over time where the overall mortality rate from heart attack fell by about half from 1980-2000:
“1970s, cardiac care units were introduced, lidocaine was used to manage irregular heartbeat, beta-blockers were used to lower blood pressure in the first 3 hours after a heart attack, “clot buster” drugs began to be widely used, and coronary artery bypass surgery became more prevalent.
1980s, blood-thinning agents were used after a heart attack to prevent reoccurrences, beta-blocker therapy evolved from short-term therapy immediately after a heart attack to maintenance therapy, and angioplasty (minimally invasive surgery) was used after heart attack patients were stable.
1990s, angioplasty & more effective drugs were introduced to inhibit clot formation, along with stents to keep blood vessels open, cardiac rehabilitation programs were implemented sooner, and implantable cardiac defibrillators were used in certain patients with irregular heartbeats.
2000s, better tests, stents became available to diagnose and treat heart attack, and new drug strategies were developed (aspirin, ACE inhibitors, beta-blockers, statins) for long-term management of heart attack and potential heart attack patients.
These kinds of trends in technology adoption in health care have been pretty unbelievable, and have also been driving spending up.
What about inflation in price levels of medical care? Clearly, medical care prices paid by households (including insurance payments) have been growing faster than price levels of the other things that household buy.
Within the health sector, since 1990 or so the most rapid increases are seen in the services in hospitals and offices, relative to the commodities. This may reflect the increased “intensity” of the content of professional services due to technology.
To determine if the spending trends have “been worth it”, we often make international comparisons, noting that our trends have been faster than other “comparable” countries. But, that’s begging the question: has it been worth it to keep spending more and more? If the “results” are worth it, then its no problem. Or, said another way, if productivity (outcome/spending) has been high, then its arguably ok to spend more, though there is always the “opportunity cost” to consider, even if there are net benefits.
Flat of the Curve Medicine
The “flat of the curve” productivity problem is often talked about. This is the general heuristic concept relating how the additional spending on health care is yielding smaller and smaller increments in health. The concept is illustrated here in the top panel.
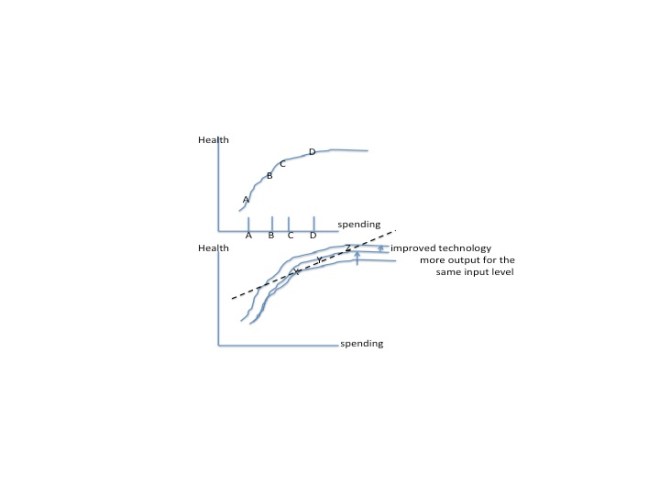
As we move from A to B we see that an increment in spending yields a sizeable increase in health. But at higher spending levels, as we move to increase spending by the same amount (from C to D) the increment of additional health is much smaller. This reflects the “flattening” of the health production function (the output-input relationship) as we spend more and more and more on health services.
But the production relationship (output per unit input) is far from rigid in health care. Over time, the infusion of new knowledge, devices, new procedures, new drugs and other things has improved the productivity of diagnosis and treatment of disease and other health problems. The second panel shows what happens when we develop new technology. If the new technology is productive at all, we should be able to get more health at each level of spending (eg the curve shifts up). Certainly this is happening (the upward shift in the health production function). The $64 question is how much is the new technology shifting it up—how much additional yield are we getting for the same spending level?
The dotted line here shows the path of technological progress. As we move over time from X to Y to Z we increase spending and we increase health. The question is, how steep or flat is this path? Is health increasing faster than spending, or vice versa? The general view of analysts is that in health care the path in the U.S. has been rather flat. The slope of this line——the health spending –health output line—— is what we might call the productivity of health spending (more properly, the slope of the line is health productivity). Health spending has been increasing faster than health. Productivity is either very low (a nearly flat line) or is falling (a curved line becoming flatter and flatter) as we spend more.
This is a heuristic discussion, so the distinction of these two possibilities is not so important. What is important is that we don’t have a good measure of “health” to actually estimate the line at all. We cant just “measure” the output of our health providers and health system, comparing it to cost and drawing conclusions directly about what is happening to productivity. Yes we can measure longevity, or disease burden, satisfaction with care, or even QALYs and happiness. But, when you get right down to it, what is the objective, what are we trying to do? Could we ever find a good metric for it? One we could use over time. We will return to this measurement quandary later.
Think about the situation in other industries where technology is changing too, and where spending is being driven by that pace of innovation. Think about computers and wireless telecom in our household budgets. We didnt used to spend anything on fast networks, computers, texting, smart phone organizers, software, chargers, synch devices, other apps, etc. We might now only spend %1-2% of our budgets on this stuff, but, the rate of increase in spending has been very very high as the technology has evolved in the last 10 years.
Is this rapidly growing spending “worth it”. Should we be worried, as in health care, about the pace of output vis a vis the pace of spending growth? Well, it certainly displaced other stuff in our budgets, but we might say the value of the new stuff is quite high. It is productive. What if we had had digi-insurance? With it we might pay only 10 cents on the dollar for all computers, smart phones, networks, software, wireless telecom packages, etc. Would we have consumed more? Of course. I would have a computer in every room, upgrades for my networks every few months, a high capacity desktop at home to do stats with the best software, biggest storage capacity, a 72″ screen, etc. You get the picture. Our whole purchasing philosophy would be different. Instead of spending 1% of our income on digi products, we’d be spending 3% of our income on it (though a lot of that would be on our fixed insurance premiums).And, what do you think would be happening to the level of technological innovation in hardware, networking, software, insurance products, etc? Would it all be worth it? Well, the productivity (output/spending) of our spending would likely be positive, but at the margin, maybe not so high. Could we say that eventually the digi world could go “flat” too?
But the growth in health spending from 15-20-25% and up up up, fueled by the rapid technology boom, might be viewed as a great thing if productivity (eg the slope of the dotted line) was not flat, and was leaping ahead, making our lives better, our jobs easier, lowering stress, making us happier and healthier, etc. Like the rapid increases in our spending in digi stuff seemed to do. If output, or outcomes, are rising as fast or faster than spending, then nobody would be asking about :how high a % of GSP or GDP can we tolerate? The sky, so to speak, is the limit.
The whole issue is measuring (or perceiving) what is happening to the trend in output or outcomes. Does it feel like what’s been happening to the digi-inflation in spending? Do health spending trends in spending feel like that? The problem is, in part, not being able to put our finger on a measure of “outcome”. Happiness has been measured, mortality, QALYs, etc. It is just hard to measure “what we get for what we pay in any meaningful way to say whether its been worth it. Though we speak heuristically about the “flat of the curve”— which implies i guess that we “feel” like the trend in productivity in health care spending isnt getting us very much extra benefit, unlike the trend in digi-spending. And, I guess we also know that the “rate of increase” is much higher than it would have otherwise been had we not had insurance to pay for it. This is an important fact, though hard to quantify “by how much is it higher spending inflation”
Hospital and Health Care Productivity
We once assigned groups of students to try to say whether productivity was going up in Mass hospitals, a much more modest problem than trying to measure it for the health system as a whole. What is happening to hospital productivity (output per input)? Not unexpectedly, the groups learned from the projects that productivity is tough to measure, due to difficulty finding an output measure. We can look at days, admissions, OP visits, or even summed DRG weights— and if we had chosen to look at these output measures, we still would have asked about the trend over time, is the QUALITY of the output getting better. Sure it is. We diagnose better, we treat better, we get better results. So, we are again left with the problem of how to actually measure these improvements in results. We dont know how fast the results are trending up to compare with the cost trend. Same problem.
Some look at the trend in the fraction of health (hospital) spending to the GSP/GDP per capita. What does that mean? If one place spends 18% of its “economic output” on health care, and another spends 22%, is one more productive than the other? Well, the fact that 18%<22% may purport to imply that this is a more productive health system, because we are using less of our scarce resources on it. True. But, how do we know that we are comparing apples to apples? Is it possible that both are spending exactly the same amount of resources on health care, and the difference is purely the result of a large difference in the GSP/GDP per capita (say that the place with 18% has a huge underground oil field which is being pumped and sold for billions of dollars a year). Other than that, everything is the same. Is one place more productive than another in health care? No. Other obtuse differences can be examined— but the point of it all is that the % of GSP/GDP spent on health care isnt a measure of productivity at all. Think about the trend in this ratio for one place. Say it is going up every year from 17%, 18, 19, etc. What does that mean? Is productivity going down? No, it depends on what we get for the increased spending. “What we get” is back to the productivity measurement problem again, as discussed above.
The key here is trying to come to grips with the issue of “what we’re really getting here in Mass or here in the U.S. from our spending on hospitals? And what has been the trend in it? Is it increasing faster or slower than the spending? Of course, the various indicators of health and well being are about the best we can do. Things like trends in medical error rates, longevity for certain kinds of diseases, preventable mortality of the population, are all possible to look at. We can also look at physical output indicators: days of care, admissions, OP Visits, DRG weights. And, whatever we use as indicators of the “output” of the system (or better yet, the hospitals) we will be left with drawing conclusions from the pattern we see in these trends, if any. Measuring the output of hospitals, and productivity, is a really hard problem, not one people write about a lot (because it is too hard) and there is no obvious data/metrics. There are lots of indicators of “output trends” but not a single measure. That’s why this is hard. In the end, we don’t know how fast productivity is improving, and if it apace with spending.
Conceptually, there is a relationship between adoption of technology, productivity and spending. We illustrate it here:
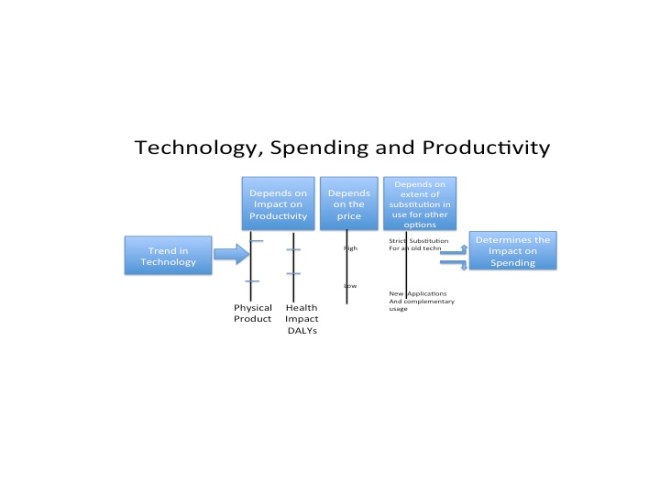
The more productive it is, the more likely the possibility that spending will fall. If we introduce a new drug that is only marginally better than aspirin, costs 1000x more than aspirin, and gets used for new kinds of application as well. The impact on spending will be dependent on the impact on productivity (whether measured in terms of health or physical productivity), on price charged, and on how utilization is affected.
Why is Technology Growing So Fast
We have been avoiding a primary question so far in this paper. The pace of innovation is high, and has proven to make patient care (diagnostic and curative care) much more expensive. What is behind all that progress (if its been progress).
The pace of scientific progress, and the pace of adoption of new innovations are not random (the result of scientific luck). There are incentives and financial constraints that cause private firms to invest more or less in Research & Development, the underlying driver of innovation. And there are reasons why the government spends so many tax dollars through NIH, DOD, NSF and other agencies on scientific work in government facilities and through grant programs with university scientists. There are reasons, and incentives, why developmental and applied work research is aimed at health care, rather than other industries like automotive or aerospace. And finally, there are reasons why we regulate and support the adoption of the new technologies in health care the way we do, as contrasted with the way its done in other countries. All of these things have contributed to a set of incentives and financial support which have caused a huge American investment in health care R&D. It isn’t happening just because American scientists are better, or because our health providers are deeply committed to quality improvement of their services. No, it is the result a deliberate choices to encourage a super sized chunk of our scarce resources to be devoted to R&D, which, by the way, has contributed the lion’s share of the growth in health spending. The pace of technological innovation was not just given to us in health care, as something God alone might will.
There are reasons why the pace of innovation is so high in health care, higher than would be the case if only private firms selling to that industry were making rational economic decisions about sizing their R&D investments and distributing those activities across the opportunities in various industries they might sell to. Some of the factors that drive high R&D investments in innovation toward health care are:
- Generally higher R&D in this country because the federal government funds directly (from tax monies) about a third of all the R&D done here, mainly funding the highly uncertain (and low return) world of basic scientific research. NIH and the other health agencies are a very large fraction of this basic research funding (some done in government labs, but most done through academic labs on grants). Across the globe, the U.S. government funds about 1/6 of all R&D in the world. We choose to subsidize R&D because our citizen-voters demand a high rate of growth in the economy (which is fueled by innovation), because we believe that progress is intrinsically good, and that both growth and scientific progress fuel economic opportunities for citizens who crave advancement.
- The federal government (society) also chooses to provide strong incentives to private companies to invest more in R&D than they otherwise would. The incentives are provided by a strongly enforced program of Patents. These protections give monopoly power for up to 17 years for the owners of the patient, allowing them to recoup a return on the investment they had to make in the R&D that led to the discovery and innovation. Another post discusses the bias of public policy in promoting R&D.
- Because of both of the above, the private organizations, including health care, that have business models dependent on innovation and scientific R&D will devote more investment into R&D than they otherwise would. Of particular importance is the focus of the government subsidy of basic research (which essentially produces a flow of publically available findings in professional scientific journals) that can be used for private gain by firms willing to invest in some future developmental (or applied) R&D to produce an innovation that can be produced and sold by the firm. By subsidizing the risky basic research activities, the firms are free to focus on the less risky kind of R&D that produces applications that can be taken to market much faster than if investments needed to be made in answering basic research questions.
- Health insurance and FFS offers a receptive financing instrument for health care innovations, one that is conducive to fast and universal adoption of new products and services. There are three points:(1) new innovations enter the health care markets by being adopted by providers and provider organizations as new products and services, with their own prices. They do not have to enter as “inputs” into bundled products (like a new radio system for an automobile) which would be hard to get accepted unless it led to cost savings). (2) consumers do not have to pay for the new stuff (except for a very very modest copay) and professionals (doctors) generally can create new service products to “sell” as revenue streams if they adopt the new stuff. (3) There are no material systems of “rationing” adoption or regulatory control on adoption of new innovation, or setting prices for the use of the innovations. Insurors have economic interests in controlling cost effectiveness of new technologies, but, with few exceptions (in the form of plans having things like “formularies”) the only constraints on usage of new innovations are clauses of “medically necessity”, which are difficult to use stringently because of push back by the clients of the insurors.
For these reasons, health care is often the preferred industry of application R&D for many entrepreneurs with new product ideas. If you are a scientist, and discovered a new alloy or material, and were looking to cash in, the chances are good that your business partners are going to urge that the next phase of research (the applied phase— where you try to commercialize the discovery) be aimed at health care. That kind of “bias” in where the applied science is targeted has been going one for a long time. Health care is open to almost any product improvements, whatever their magnitude, and almost without regard to what those improvements cost! Looking at the data, health care also spends the most, by far, on R&D.
% of revenue spent on R&D is highest in health care
Pharma Medical Devices Telecom Auto Electronics Aero/Def
12.9 11.4 5.6 4.1 3.9 3.1
Also, there are reasons to be concerned that the pace of innovation driven by these factors is leading to declining productivity of innovations, with the only data on this being in the pharmaceutical industry. The referenced paper (represented here by my cryptic and superficial chart) studied dozens of published studies of placebo controlled trials of new chemical entities approved as new drugs by the FDA over 40+ years.
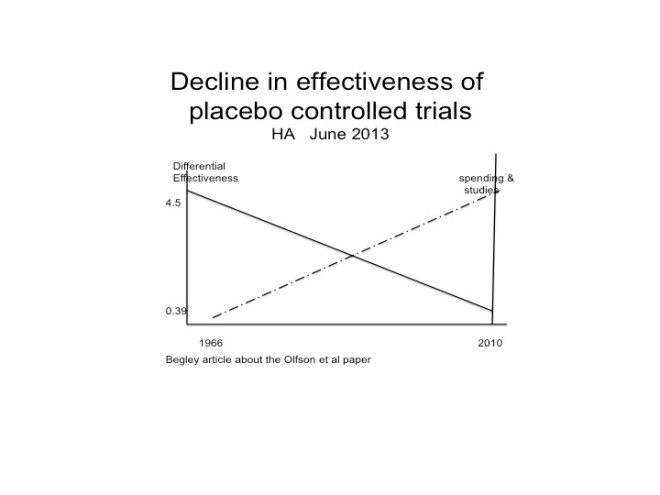
The key measure was the effectiveness of the NCE relative to the placebo, measured here ion the vertical axis. There was a rather continuous decline in the size of the relative effectiveness of the approved drugs over this interval. It isn’t clear from the paper, or the research, what exactly this means, other than the new drugs approved today are about 1/10th as effective vis a vis the placebo as they were 40+ years ago. Does this mean that this is the result of some kind of “diminishing return” to a larger, more vigorous R&D process in the industry? Not necessarily. Does this trend generalize to R&D produced innovations in medical devices, diagnostic equipment, and other things? Of course not. But, it may mean that as the bar (current practice standard=placebo) gets higher and higher it become less likely that research touchdowns will be scored, and we’ll just have to settle for a first down here and there.
But, it may mean that larger R&D activities in forms that are larger, and want to grow faster for their investors, have developed better approaches for speeding and managing the yield of their research activities (yield would be revenue per dollar of R&D invested). The process of bringing new ideas to market may be better now than before in these organizations. Things that did not appear to cut the mustard years back may not be so quickly tossed aside today. Better management may also creating better ways to target research activities to getting a successful product than before. Or maybe it is marketing that got better. If the marketing process is now better able, than before, of “selling” clinicians on the idea of a “marginally better” product then this could explain the trend (eg years ago the “marginally better” ideas were trashed because they couldn’t be marketed effectively).
But, whatever the explanation, the productivity of the newly approved drugs is certainly lower than 40 years ago.
